> ## Documentation Index
> Fetch the complete documentation index at: https://docs.1price.co/llms.txt
> Use this file to discover all available pages before exploring further.
# Determine: Results
> Reading the results of the experiments
Within 24 hours of your experiment's launch you'll start seeing data on the
Results page.{" "}
1Price offers experiment results through each step of the subscription journey to give you a comprehensive view of the impact of your test. The following document will uncover ways you can understand your experiment results.
### Video Breakdown
**CodeSandbox:** You can see the exact working code to help with
implementation
[here](https://codesandbox.io/p/devbox/1price-demo-forked-fwylmj?workspaceId=b5b1c612-c839-4312-b977-a30fb346f3f2)
### Dashboard Screen
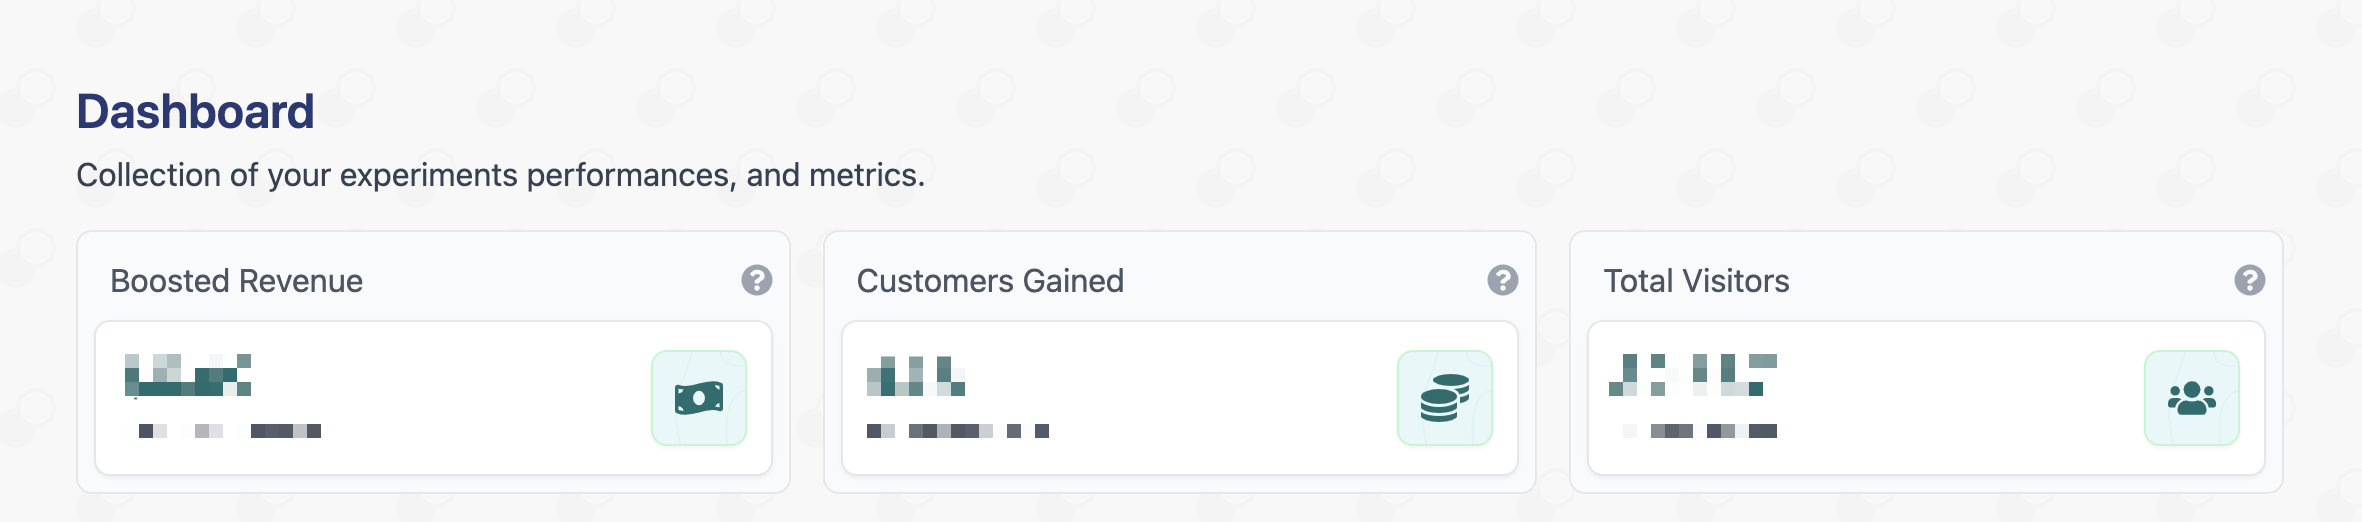
On your [Dashboard](https://app.1price.co/dashboard), you will see the tracking of your workspace analytics for: `Boosted Revenue`, `Customers Gained`, and `Total Visitors`.
These are analytics based on **all experiments** added together since using 1Price experiments.
### Overview Screen
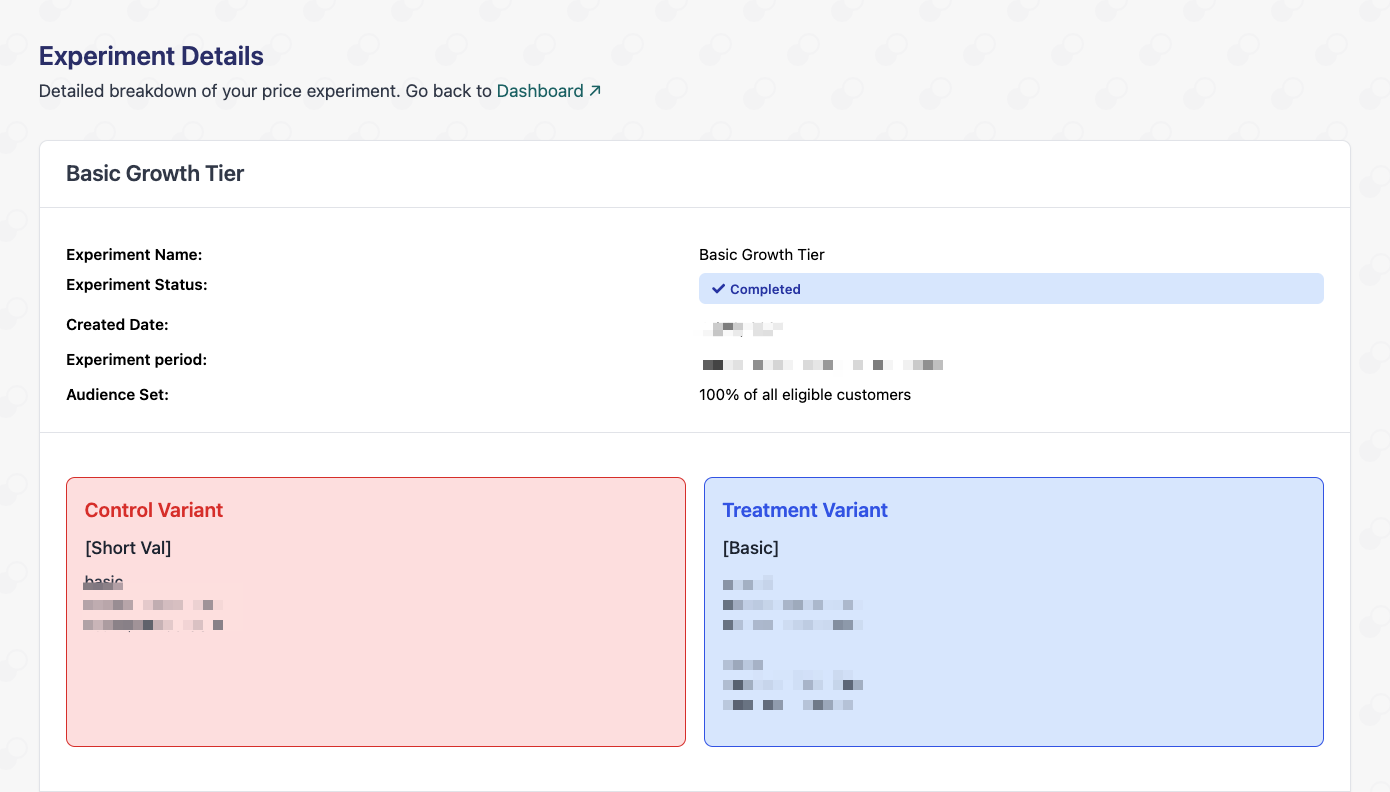
Within each experiment, the initial screen shares details such as `experiment period`, `control group`, and `treatment group`:
### Customer Journey Tables
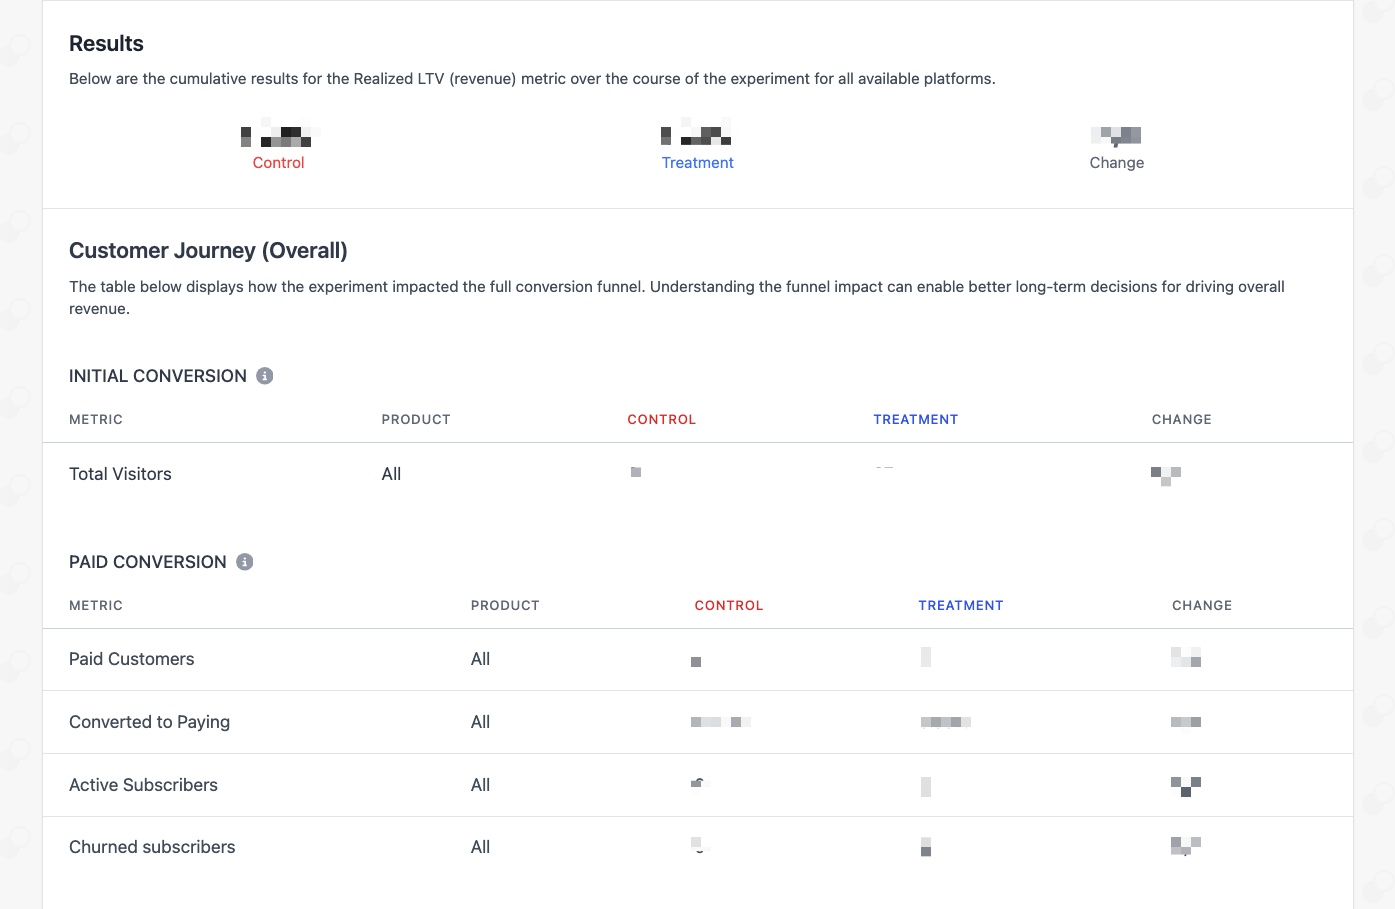
The customer journey tables act as a comprehensive view of the customer funnel.
For simplicity, we've broken up experiment results into three tables:
1. **Initial Conversion:** for understanding visitors rates as the top of the funnel. Metrics are used as a way to predict future conversion rates.
2. **Paid Conversion:** for understanding how your initial conversion trends are translating into new paying customers.
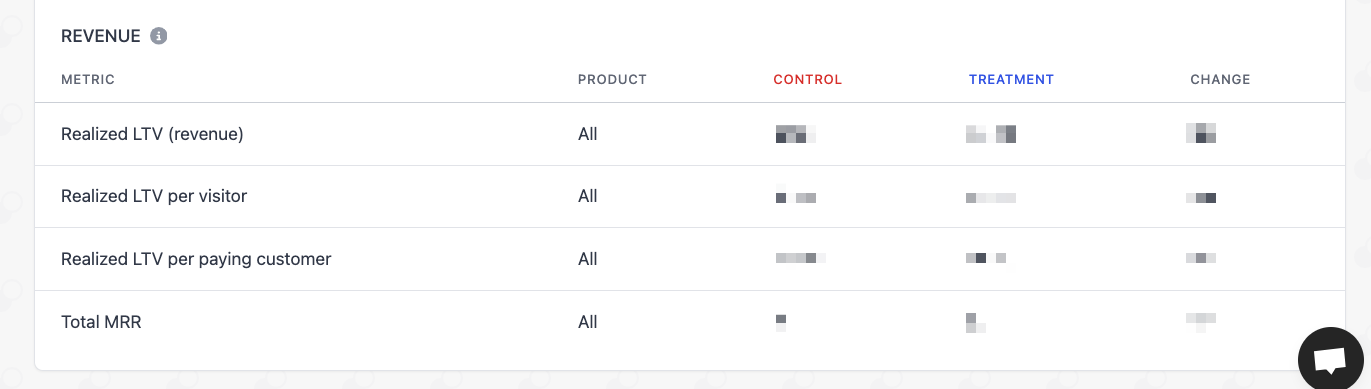
3. **Revenue:** for understanding the impacts of two others tables on metrics such as monthly recurring revenue (MRR) and lifetime value (LTV)
### Metric Definitions
The total amount of visitors that have seen your pricing.
Users that subscribe to your plan.
The number of users who convert to paying subscribers.
The number of subscribers with an active plan.
The number of customers who were previous subscribers but have since cancelled
their plan (note: relevant for one-time products).
The total revenue you've received from each experiment variant.
The total revenue you've received from each experiment variant, divided by the
number of total visitors.
The total revenue you've received from each experiment variant, divided by the
number of paying customers in each variant.
The total amount of monthly recurring revenue (MRR) gained from the experiment
variant.
Only new users are included in the results to keep your control and treatment
cohort equal.
### FAQs
**What happens to customers that were enrolled in an experiment after it's been stopped?**
New customers will no longer be enrolled in an experiment after it's been stopped, and customers who were already enrolled in the experiment will begin receiving the `Default Offering` if they reach a paywall again.
At the moment, we do not continously track customer behaviours after the experiment has terminated.
**How can I review the individual customers who were enrolled in my experiment?**
We are currently working on a `Get` or `Create Subscriber` endpoint which will be able to help you determine if an individual subscriber was enrolled in an experiment, and can then pass that fact to other destinations like an analytics provider like Amplitude & Mixpanel, or your own internal database.
In the meantime, you can ensure consistency of price per user by adding the `uniqueId` to our endpoint in [Code](/build/code).
 These are analytics based on **all experiments** added together since using 1Price experiments.
### Overview Screen
Within each experiment, the initial screen shares details such as `experiment period`, `control group`, and `treatment group`:
These are analytics based on **all experiments** added together since using 1Price experiments.
### Overview Screen
Within each experiment, the initial screen shares details such as `experiment period`, `control group`, and `treatment group`:
 ### Customer Journey Tables
The customer journey tables act as a comprehensive view of the customer funnel.
For simplicity, we've broken up experiment results into three tables:
1. **Initial Conversion:** for understanding visitors rates as the top of the funnel. Metrics are used as a way to predict future conversion rates.
2. **Paid Conversion:** for understanding how your initial conversion trends are translating into new paying customers.
3. **Revenue:** for understanding the impacts of two others tables on metrics such as monthly recurring revenue (MRR) and lifetime value (LTV)
### Customer Journey Tables
The customer journey tables act as a comprehensive view of the customer funnel.
For simplicity, we've broken up experiment results into three tables:
1. **Initial Conversion:** for understanding visitors rates as the top of the funnel. Metrics are used as a way to predict future conversion rates.
2. **Paid Conversion:** for understanding how your initial conversion trends are translating into new paying customers.
3. **Revenue:** for understanding the impacts of two others tables on metrics such as monthly recurring revenue (MRR) and lifetime value (LTV)
 ### Metric Definitions